We all hear about the word "tornadoes", but what about "solar tornadoes"? Are there any tornadoes on the Sun?
Before introducing solar tornadoes, we should first know about solar prominence (in Chinese, 日珥). Solar prominences are a giant structure in the solar atmosphere. They usually consists of dense plasma with rather low temperature (~ 10000K) in the solar corona. Just as this image shows.
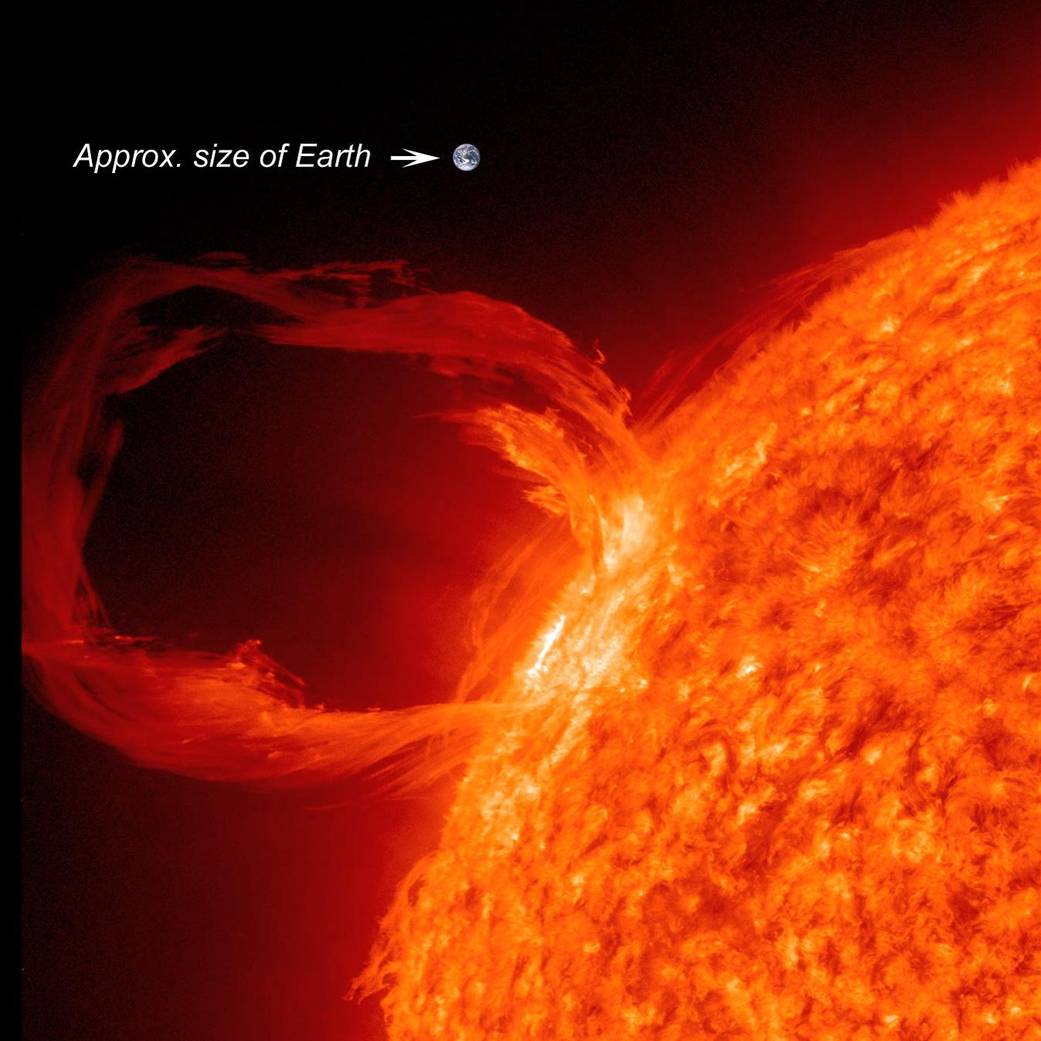
A giant prominence that is much bigger than Earth. (Credit: NASA)
Sometimes when we see a part of prominences, such as the legs, we may find its legs seem to be rotating. This kind of scenario resembles the tornado on Earth, so people named it as "solar tornado".
A fast evolving solar tornado observed in 2011 by SDO/AIA. (Li et al. 2012)
However, whether such motion is real rotation or not is still under discussion. In this work (Yang et al. 2018), we found two tornado-like prominences observed with the Interface Region Imaging Spectrograph and did spectral analysis.
IRIS is a satellite designed to observe the solar atmosphere (from photosphere to transition region). it can obtain high resolution images and high spatial and time resolution spectral data. In this work, the data obtained by IRIS provided us with information of plasma of solar tornadoes in a very high resolution.
The following image show the first solar tornado, in the left it is observed in passband 2796, which corresponds to the temperature of around 10,000K (the typical temperature of prominences); and in the right is passband 1400, corresponding to about 80,000K. The white vertical line is the location of slit, which can obtain spectral information.
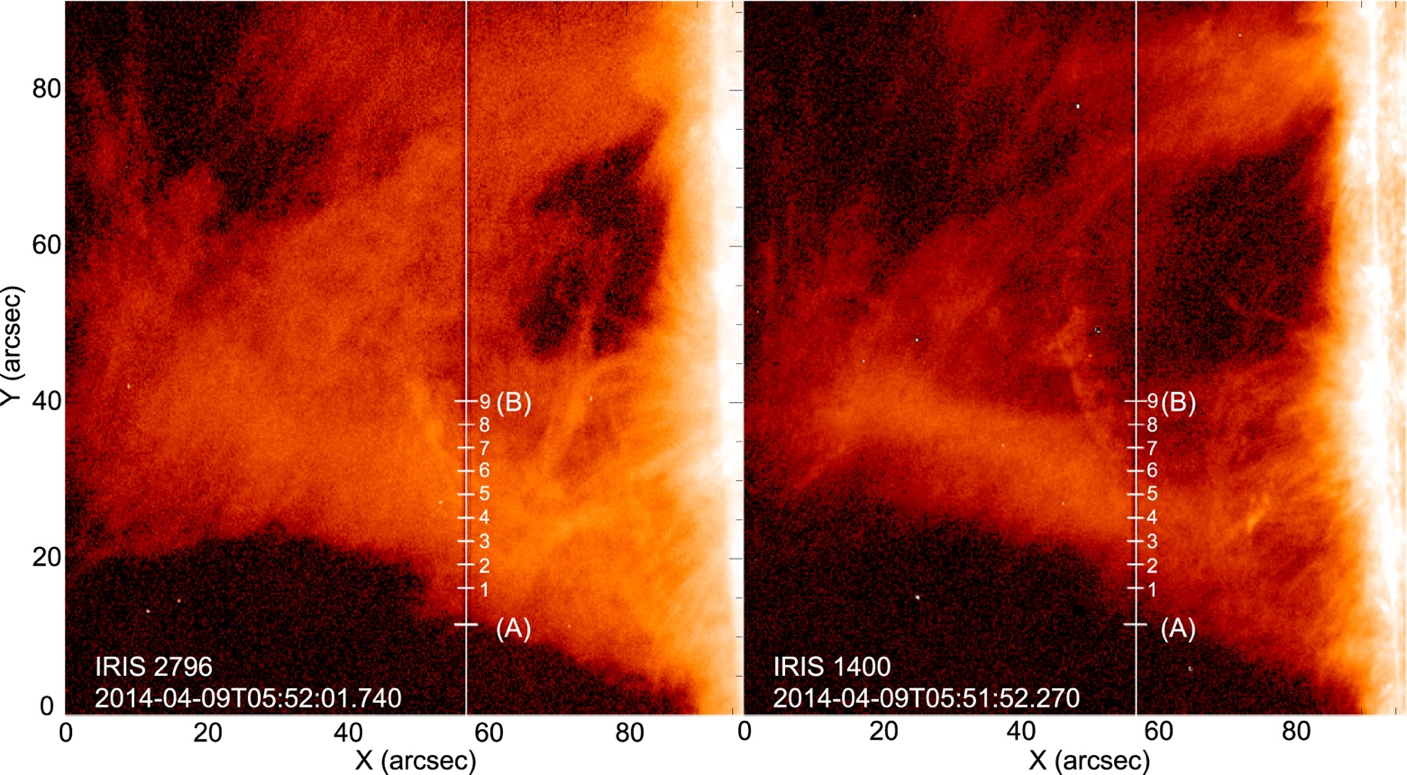
A solar tornado observed with IRIS, in the passbands of 2796 and 1400. (Yang et al. 2018)
We then did single Gaussian fit (the usual profile of spectral line shows the shape of Gaussian profile, so we usually do single Gaussian fit to the line profile and derive more plasma parameters) to the line profiles of Mg II 2796 Angstrom and Si IV 1393 Angstrom and obtained the maps of intensity and Doppler velocity, as this figure illustrates.
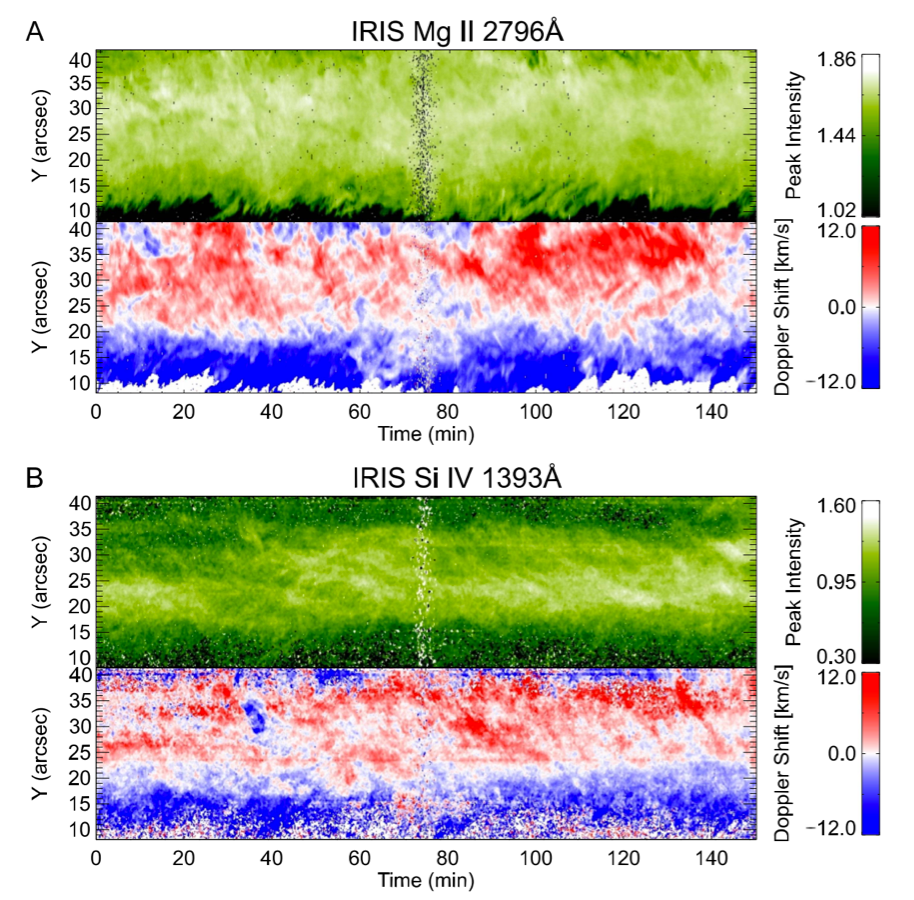
Intensity and Doppler velocity maps derived from single Gaussian fit to two lines, the split red and blue doppler pattern shows a sign of rotation. (Yang et al. 2018)
From the Doppler maps, it is clear that on one side of this solar tornado it's all red shift (meaning the material is moving away from the observer), while on the other side it's always blue shift (the material is moving towards us). Imagining there is a cylinder, and there's plamsa flowing around it, as the cartoon depicts, then we can see such Doppler pattern. So this kind of result could be caused by rotating materials or helical flows around the central part of the tornado.

A cartoon showing the physical picture of the motion of this solar tornado. (Yang et al. 2018)
If we plot the average velocity and intenisty across the solar tornado, then we can find for the result of Si IV, the intensity (dashed line) is highest near the center of the tornado, where the velocity (solid line) is around 0. Si IV line is optically thin, which means the emission we receive in the center of the tornado is the integration along the line-of-sight. Considering the previous picture of plsama flowing around a cylinder, then in the center the materials are the most, which will lead to the highest emission, causing the peak of intensity. Therefore, the rotation motion could be a very possible explanation.
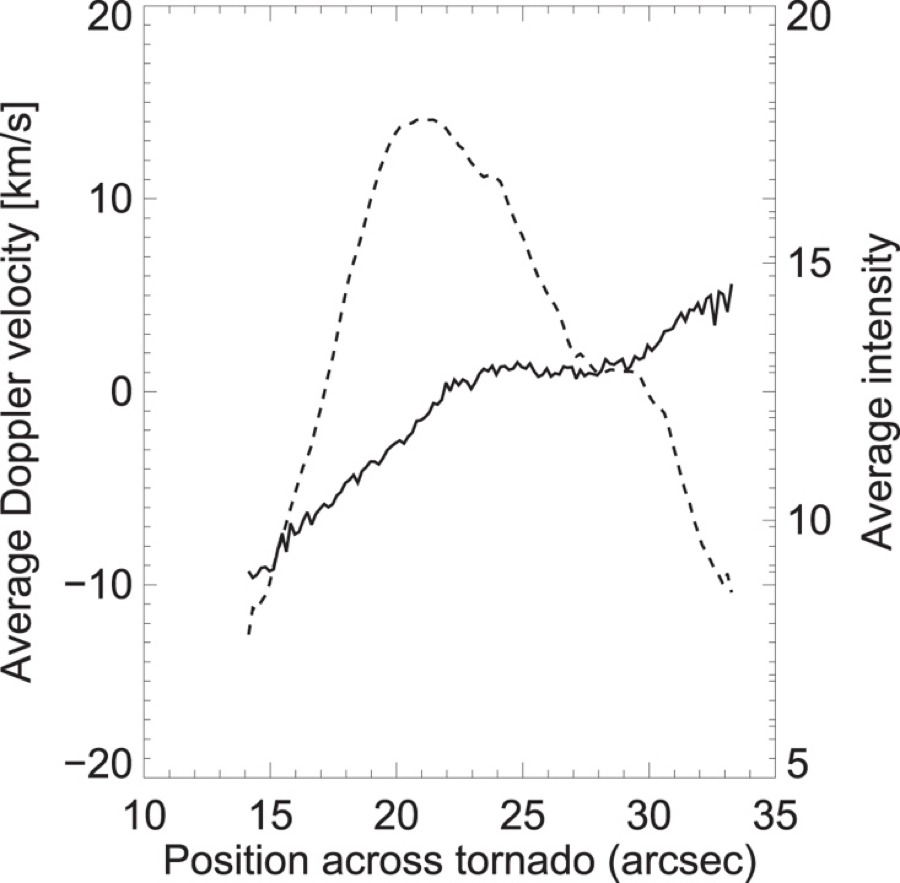
The intensity reaches its peak near the center of the tornado (velocity ~0). The solid line means velocity and dashed line is intensity. (Yang et al. 2018)
We also want to make sure if there is any apparent oscillation. So we plot the time evolution of velocity (the solid line) in red and blue shifted regions. It is apparent that in either region, the Doppler velocity never changes its sign, such results can exclude the existence of strong oscillation in the solar tornado.
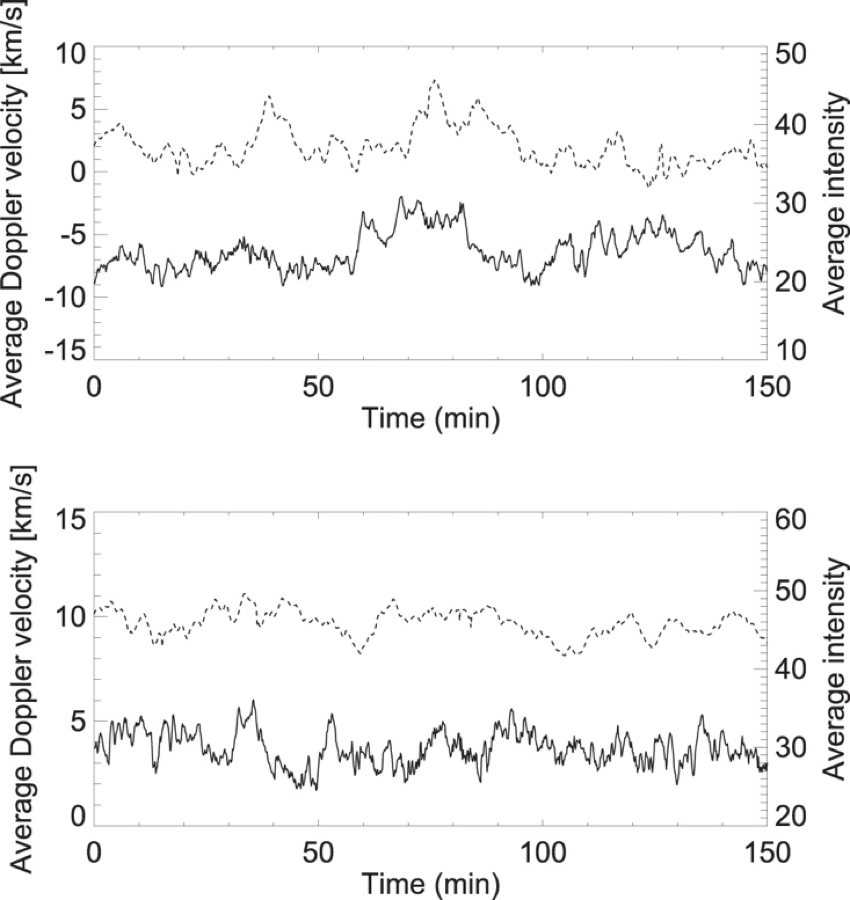
The upper panel is blue shifted region, the lower panel is red shifted region. The velocity in either region never changes its sign. (Yang et al. 2018)
For the second solar tornado, we did similar analysis.
In conclusion, from the high resolution Doppler maps, we can find it is very possible that the motion of these two solar tornadoes are caused by cool materials flowing around a rather static central structure. Perhaps there may be some minor oscillations or counter-streaming (flows in two opposite directions) superimposed on the motion of the two solar tornadoes, but at least the rotation motion is the most suitable explanation.
For more information about this research, please refer to our paper published on The Astrophysical Journal this year. Click here for more details.